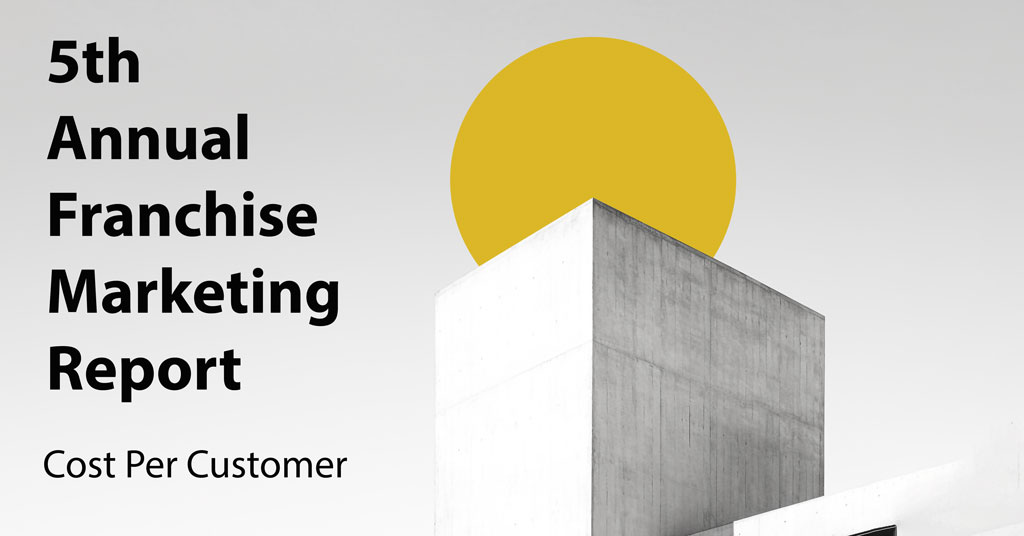
5th Annual Franchise Marketing Report: Cost Per Customer
Benchmarking data and analysis at its best
Results from the 2023 Annual Franchise Marketing Report (AFMR) were revealed this summer at the Franchise Customer Experience Conference, or FCXC.
The AFMR was created at the request of our FCXC conference advisory board to develop relevant content for CMOs and to learn more about their needs and challenges. Its purpose is to provide the data and analysis CMOs and other top marketing executives need to measure their success and learn how they can do better at a job that seems to get more complex with each passing year. (Think digital!)
The AFMR delivers invaluable benchmarking data that provides franchise consumer marketers with the insights they need to know how they stack up against other franchise brands and their industry. In short, the report is a unique resource franchise marketers can use to improve the effectiveness of their marketing efforts and make the most efficient use of their marketing budgets.
Data was collected from a group of marketing leaders at 65 franchise brands who each completed an in-depth questionnaire. Respondents’ roles ran the gamut: co-founder, CEO, president, COO, CMO, chief growth officer, VP of marketing, director of marketing, marketing and operations director, director of advertising, marketing and communications director, general manager marketing, director of digital marketing, and VP of franchise development. Their responses were aggregated and analyzed to produce an in-depth look into the marketing practices, budgets, and strategies of a wide cross-section of franchise brands and sectors.
What follows are selected highlights from the 2023 AFMR, which offers commentary and analysis that provides context, insights, and a detailed look into the data contained in the report.
COST PER CUSTOMER
The survey asked respondents if they tracked acquisition costs per customer. Diving down by industry, Food and Retail Food were the lowest at 33% each, with Retail (non-food) the highest at 80%. Looking at number of units, there’s a clear pattern: the more units a brand has, the more they track their customer acquisition costs.
|
Do you track acquisition costs per customer? |
|||||
|---|---|---|---|---|---|
|
By Industry |
Yes |
No |
By # of Units |
Yes |
No |
|
Food |
33% |
67% |
<25 |
45% |
55% |
|
Retail food |
33% |
67% |
26–100 |
56% |
44% |
|
Retail (non-food) |
80% |
20% |
101–250 |
75% |
25% |
|
Service (brick-and-mortar) |
72% |
28% |
251–500 |
75% |
25% |
|
Service (territory or population) |
56% |
44% |
501–1000 |
100% |
0% |
Share this Feature


Recommended Reading:

FRANCHISE TOPICS
- Multi-Unit Franchising
- Get Started in Franchising
- Franchise Growth
- Franchise Operations
- Open New Units
- Franchise Leadership
- Franchise Marketing
- Technology
- Franchise Law
- Franchise Awards
- Franchise Rankings
- Franchise Trends
- Franchise Development
- Featured Franchise Stories
FEATURED IN
Franchise Update Magazine: Issue 3, 2023


Franchising.com is produced by Franchise Update Media. Franchise Update Media has its finger on the pulse of franchising with unrivalled audience intelligence and market driven data. No media company understands the franchise landscape deeper than Franchise Update Media.
P.O. Box 20547
San Jose, CA 95160
PH. (408) 402-5681
 The franchise listed above are not related to or endorsed by Franchise Update or Franchise Update Media Group. We are not engaged in, supporting, or endorsing any specific franchise, business opportunity, company or individual. No statement in this site is to be construed as a recommendation. We encourage prospective franchise buyers to perform extensive due diligence when considering a franchise opportunity.
Copyright © 2001 - 2025. All Rights Reserved. Legal Notices | Privacy Policy


